


Give Peter Wells a chart and he can go anywhere. Forget a boat; all the Chappy Ferry captain needs is a nautical chart and he’s a world traveler.
The knickknacks, boats in the yard, and collectibles stacked around Wells’s Chappaquiddick home indicate this is someone who is intrigued by plenty of things, and for whom the imagination is easily accessible. His charts are neatly stacked in large gray drawers, ready to pull out at a moment’s notice.
“The great thing about maps and charts is you can wander freely all over the earth,” he says. “There’s no fence to stop you, no trespassing signs. It’s all information. And if you have information, you have access.”
He has collected nautical charts since he was in sixth grade when he began working at Avery’s, a general store on Main Street in Edgartown that is now home to Sundog. Charts were frequently updated to reflect changes in the location of buoys or obstructions, and old ones were taken out of circulation.

These changes were gold for a young Wells. “When the new charts came out, I started taking some of the charts home because all we did was cut them up to make little memo pads,” he says.
“At home in the living room, I would lay out the charts of Long Island – there were six or eight of them, from New York to Cuttyhunk – and I’d lay them out. It was like you were up in a plane and you could see the world laid out at your feet.”
Wells had a flat trundle tray under his bed as a kid. When the charts got wrinkled, he would take to the ironing board.
“My sisters would give me a lot of crap for that,” he laughs. “Oh, Pete’s doing some ironing, take the curtains up there while he’s at it. I just wanted to flatten them out! It’s just a piece of paper, but look at all that stuff somebody’s drawn on there.”
Wells is shy to put a number to how many charts he’s amassed over the years. In addition to his own collection, an uncle bequeathed him his collection just before he died. Some of them are on display, but most are safely stashed away. He pulls them out of their respective trays one by one like delicate sheets of tissue.
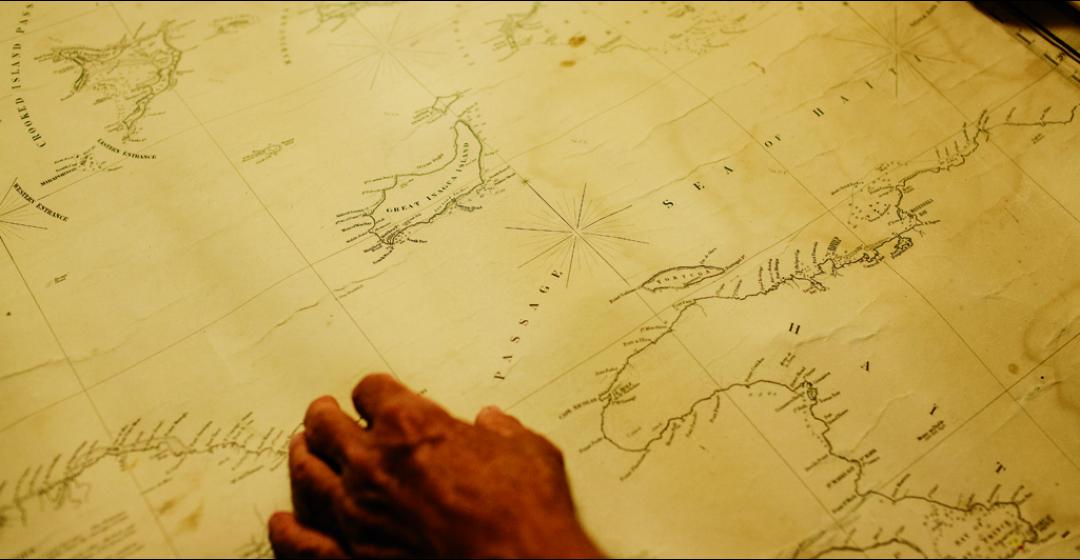
“If you go on the internet you can see this whole shoreline, but not in a big chunk like this,” he says. “If you’re going to take a ship from the U.S. to Africa, you’d like to see both points on one chart.”
The chart in question is one he bought as part of a small spending spree after hearing the news last year that the federal government would no longer be publishing new paper charts, and would instead only offer them electronically through a print on-demand system. “I just got this because it’s a shame they’re not going to be printing anymore,” he says. “I was scared and it was an excuse to get it. Look at all the detail on this stuff. It’s a great thing.”
He also bought a chart of Balboa Island in California; a car ferry there is the model for the Chappy Ferry. “I thought, well, I better get one of those because I’d like to go visit them someday,” Wells says. “This way before you go there you can feel like you’ve already been there, you can look over the whole thing.”
And Lake Tahoe, another place he’d like to visit someday. “There’s a ferry boat there, look at the depths – it’s four hundred feet deep,” he says, nearly breathless. “Vineyard Sound only gets to one hundred feet deep.”
And Newfoundland: “Look at all the writing and little channels. There’s so much going on there and you can go there, just by having this in your lap.”
As it happens, Wells is not the only Vineyard ferry captain with a weakness for nautical charts. Captain David Dandridge of the Steamship Authority has been taking care of charts since the 1980s, when he worked on a research ship for Columbia University as second mate.
“That ship went all over the world, around and around. We had charts of the whole world onboard,” he says, rocking backward in his chair. “In working with them I found there were all these charts, most of them published by the British Admiralty, that were using information and images from the nineteenth century. They were by far the most beautiful charts of all the ones we had.”

As with most collectible items, Dandridge says finding a chart of interest can be challenging. He’s dealt with old book dealers, poked around the antique shops, and traded some on and off over the years. As a collector, he’s most interested in old charts from the nineteenth century. But nonetheless, he sees the end of new paper charts as a turning point.
“You can recognize it as an end of an era,” he says of the antique charts, which can run upwards of $1,000 today. “What the U.S. government did in terms of gathering data and turning it into a presentable utilitarian format was, in my mind, the pinnacle of government function.”
Preparing accurate charts of the coast began in 1807 when President Thomas Jefferson signed into effect “an act to provide for surveying the coasts of the United States.” The new U.S. Office of Coast Survey was responsible for hydrographic surveys and producing nautical charts, mapping the entire coastline. The Island’s own Henry Whiting was a topographer for the Survey between 1838 and 1897. “The degree to which the coastal survey combined hydrographic and topographic information was without equal,” says Dandridge, and the charts from the late nineteenth century were “without comparison.”
It was slow, expensive, methodical work that only began with taking measurements and soundings. For instance, it took close to twenty years to gather the data and complete an 1870 chart of Block Island Sound in his collection.
“Charts had to be engraved on copper plates,” he says. “Somebody had to draw the chart and that had to be transferred reversed onto a copper plate. Then a man had to cut out each little speck to create the copper plate form so the printing could be done.”
Dandridge has one chart that was once housed in the offices of the Survey itself in Washington, D.C. On the bottom of the chart is a handwritten note that says: “the engraving of this chart I was told cost $100 a square inch.”
Dandridge stores many of his charts, but keeps a few others on display throughout his Lagoon Pond home. The stairway tells a story of oceans near and far. From storage he brings out a large chart of Portugal. The detailed lines hang from one end of the paper to the other like a rigging of a ship. It is a nineteenth century chart with depths and coves labeled in perfect script.
“It’s representative of the end of the style of private printing,” he says. “There’s different presentation of the lines and multiple compass roses, a more elaborate legend and a great many ports along that shore.”
“Why did we get away from this?” he asks. “Isn’t that elegant?”